Futures Should Be Composable
Recently, and for the first time in my career, I have the opportunity to implement a large, highly concurrent application. After seeing a lot of interest in Java’s new Virtual Threads, I decided to try them out. I’ve done a decent amount of concurrent programming, so I felt like it would be relatively easy to get the project started and grow it. From what I encountered, Java’s Future abstraction is not up to the task.
Without too much backstory of what I looked at, I made a bet: Futures and blocking are the right abstraction. This means:
Avoid any sort of callback hell. Generally, blocking
get()calls are the right way. This is the same bet that Golang makes, with blocking being the norm. Lean into the scheduler to make the code work.Skip flow control. Reactive Java, like
MonoandFluxare work arounds for the Java problems of a decade ago. The stack traces are impossible to understand, and the exception handling in general doesn’t mesh with the rest of the language. It served its purpose, but avoid it.Avoid API dependence on
CompletableFuture. This class is bloated to the max. Every time I want to call a method I need to look at the docs, then get mad the code has nearly zero Javadoc, Look up theCompletionStagefor the specification, and finally scratch my head as to how it’s subtly different than nearly identically named methods nearby. Also,CompletionStageis practically impossible to implement, and is missing all the useful methods ofFuture.
Thus, I decided to make Future<T> the standard return type and interface of choice for my code.
Threads and Futures
In Java, Futures were designed around a thread pool. The idea being work would be scheduled onto
an Executor(Service), and return a Future
Unlike Futures or Promises in other languages (notably Javascript), Futures in Java had the concept of being associated with a thread. To see why this is interesting, take a look at this method on the interface:
public interface Future<V> {

    /**
     * Attempts to cancel execution of this task.  ...
     */
    boolean cancel(boolean mayInterruptIfRunning);
}
Two things are interesting here:
- Futures can be cancelled. Other languages and libraries often do not support cancellation. This is a special feature.
- Interruption. Java has a special feature of Threads called interruption, which allows other threads to ask a sleeping thread to wakeup, and possibly stop waiting for some event.
This is a very useful thing to have, as it means we don’t have to commit to doing the work in the
thread, should things change. As far as I have seen, almost no other programing model has this
as a core part. Additionally, to implement this yourself, it would be challenging. As a quick thought
experiment, I would ask the reader to think how they would implement this? Using something as
basic as pthread_cond_signal and pthread_cond_wait require holding a lock, which Java’s
implementation doesn’t! How did they do it? (See the link above for an explanation of the
magic).
Thus, Futures, at least when introduced originally, strongly implied attachment to a thread.
Threadless Futures
As of Java 25, there are three main implementations of Futures in the JDK:
FutureTask. This is both a
Runnableand a Future, and is intended to be extended. It holds a reference to the “runner” Thread, which is mounted and unmounted when the task runs and completes, respectively. Cancelling this Future can interrupt the runner Thread.CompletableFuture. While I think the implementation is way overengineered, it is the more powerful of the implementations. It is full featured, and has a solid, reliable way to chain work together.
ForkJoinTask. This happens to be a Future, but I haven’t seen anyone seriously use it as one. I mention it here for completeness, but it’s more meant for Fork-Join style work, and less for complex, heterogeneous work items.
CompletableFuture is the main implementation of interest, since it is capable of building a general DAG of computation.
Consider the above. CompletableFuture, hereafter “CF”, is a general purpose computation tool. The dependency graph between Future stages is built dynamically, meaning the whole graph is not known ahead of time. Each CF can be used to notify multiple downstream CFs. Two CFs can be used to complete a single downstream CF. The key takeaway here is that any individual CF does not know what other CFs depend on it.
A consequence of this design decision is that cancellation doesn’t have a clear meaning for
CFs. What does it mean for a CF to be cancelled, and the mayInterruptIfRunning bit is set?
The CF may be a combination of many other CFs. There may be no thread at all attempting to
fulfill a particular CF. The linkage between a CF and a Thread is weakened. As a result,
CompletableFuture does not cancel the underlying thread. (because there may not even be
a thread)
Cancellation and Bi-directionality
Is giving up cancellation that big of deal? Well, maybe. In the world that CF was born into, threads may not have played as big a role. CF is decidedly push based, despite its predecessor being pull based. As computations complete, they pop their Treiber Stack of dependent CFs and fulfill them. Each downstream CF in the DAG is completed, usually on the thread that is completing the current CF. (As an aside, this is one of the reasons there are a jillion overloads in CF; they needed a way to schedule the downstream “callback” work potentially on a different thread.) Keeping track of which thread is doing the async work may not have been that valuable. Since the idea of a thread working hard to fulfill a future is gone, where’s the need to interrupt the thread?
Enter Virtual Threads. It’s now possible to have as many Goroutines
Green Threads
M:N Threads Virtual
Threads as you want. They can all block without consequence waiting for CPU or IO bound work
to complete as they patiently await to fulfill a Future. The idea and value of cancellation now
seems more tenable.
CompletableFuture and Chaining
Let’s look at how CFs chain together, in a simple, unidirectional chain.
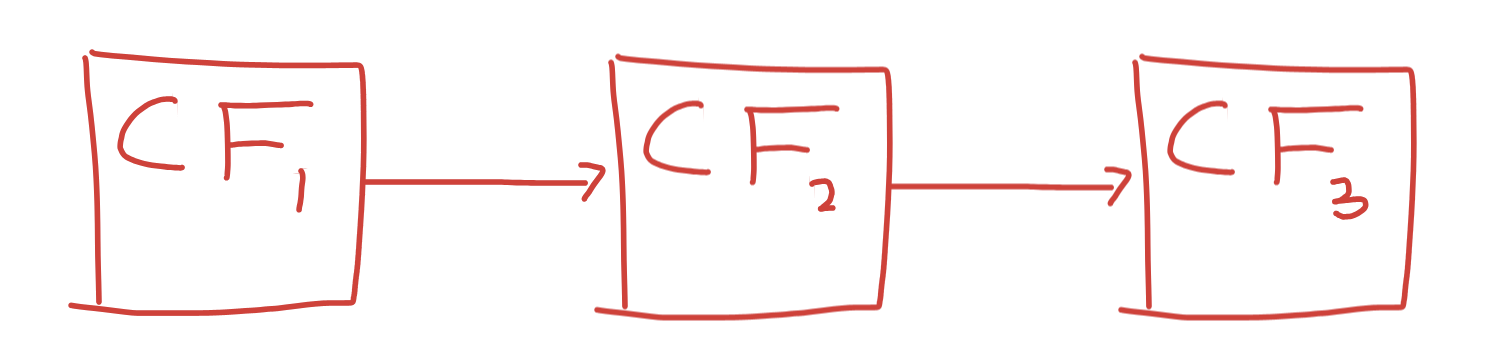
When CF 1 completes, it notifies (and completes) CF2. When CF2 completes, it notifies CF3. The flow is from left to right. Control flow only goes one direction. Consider the following snippet of code:
// Build the HTTP Request
CompletableFuture<HttpRequest> requestFuture =
    CompletableFuture.completedFuture(request);

// Issue the request
CompletableFuture<byte[]> httpResponse =
    requestFuture.thenComposeAsync(
        req -> fetchHttp(req), executor);

// Validate and convert the response
CompletableFuture<MyObject> parsedResult =
    httpResponse.thenComposeAsync(
        rawJson -> validateAndConvert(rawJson), executor);

System.out.println(parsedResult.get());
Each stage depends on the previous one.
Why Cancellation Matters
Using the snippet above, instead of printing the result, suppose the parsedResult CF is
returned to a caller. Also suppose that the caller is an RPC, and the RPC is cancelled
for whatever reason. We want to cancel the work being done to avoid consuming memory and
threads. How well does this work?
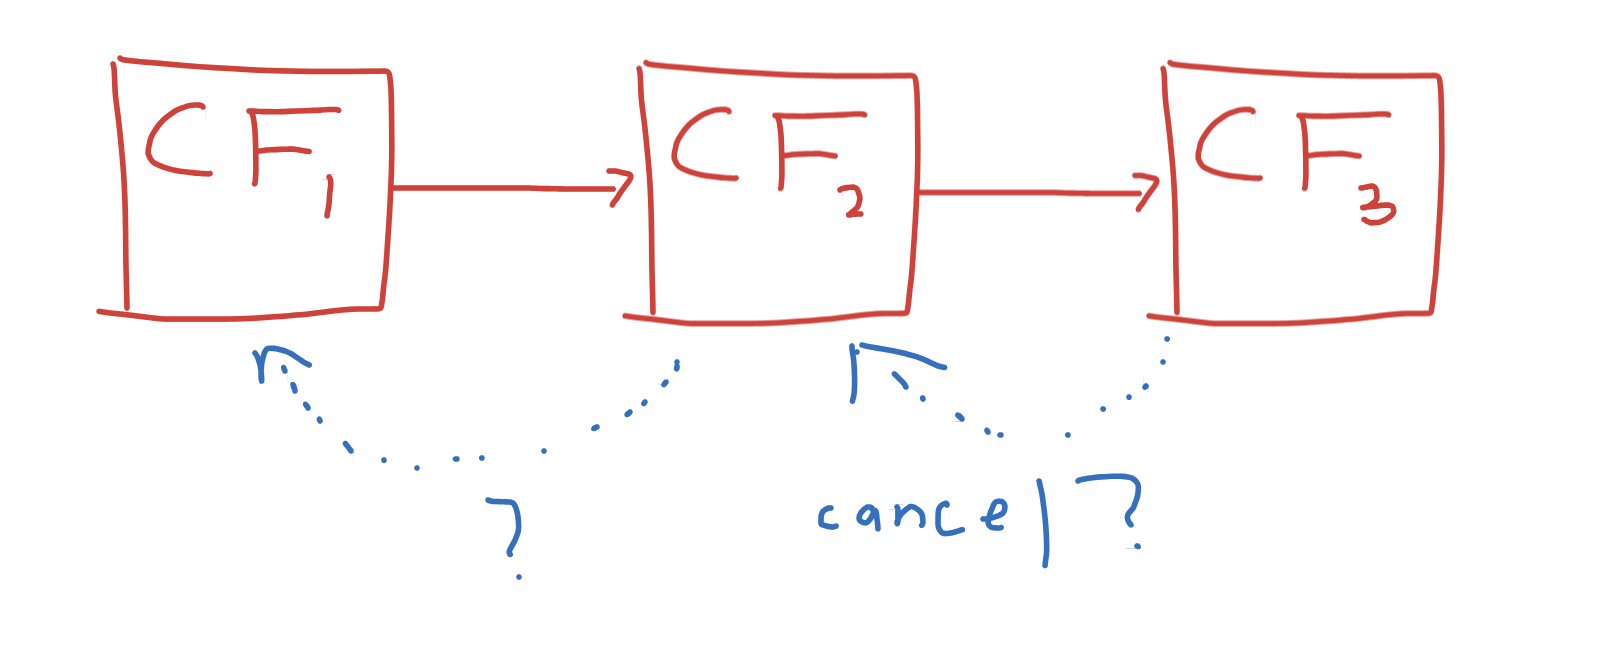
Despite CFs being chained together, they are only chained in one direction! Whoever
cancels the CompletableFuture<MyObject> parsedResult object, it won’t stop the HTTP
request. The parsing future, which has yet to be assigned a thread, has no way to
indicate that the upstream result is no longer needed. In a sense, dependency is a
singly-linked list, with no way to get back to the original CF.
You might suggest that this linkage be added, and the CF class could be made to propagate cancellation of a downstream CF to the upstream. However, this is where the DAG property bites us. Consider the following, legal, CF chain:
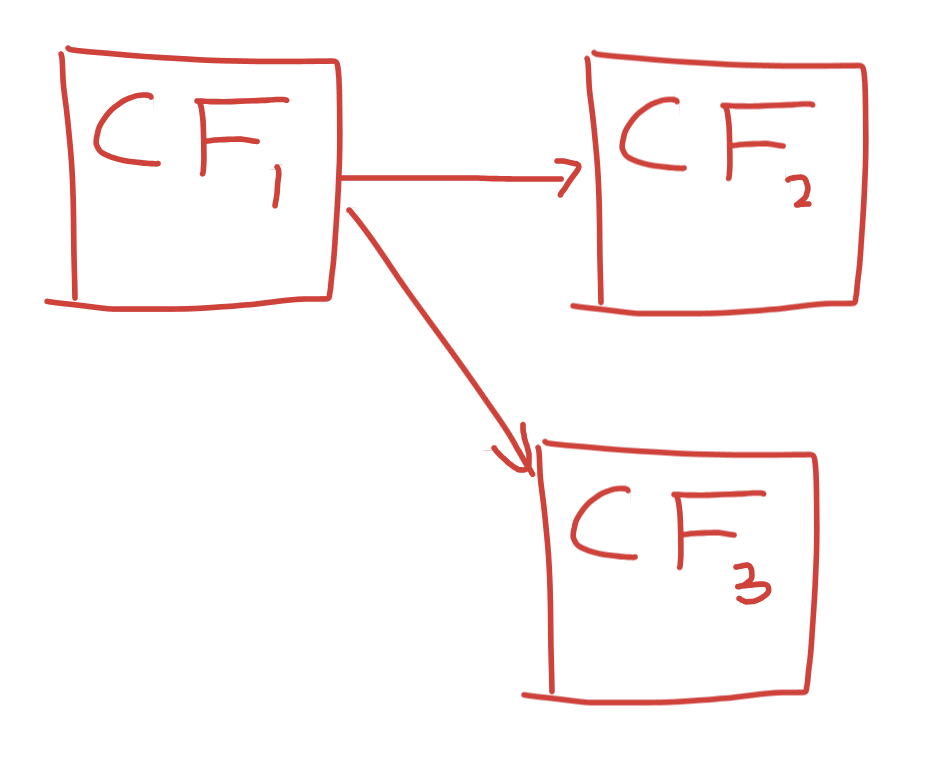
Cancelling one of the downstream CF’s doesn’t mean the otherones should be.
Without properly cancelling futures, it means that there is a risk of consuming limitted resources. While it may be okay to do a little extra work if the RPC client cancels their request, it’s not okay to consume all threads and connection pools on responses that will never be seen. (In my own work, we saw this result in an OOM due to a runaway executor that kept adding threads.) Cancellation matter for stability.
Bi-directionality
When thinking through a solution to this problem it becomes obvious that it can’t be solved
by just added a cancel listener to each CF. Someone will eventually forget to add it and
drop the link. The real problem is that the implementation of CF, and the general interface
contract of Future, don’t afford it. Futures do one thing well: defer execution. However,
this is not enough. The true problem is that only results and exceptions flow from one future
to another but not the consumer’s interest in the result.
I have to say I unfairly judged Reactive Java here, with their fully featured cancellation and
flow control mechanics. Originally I had written them off because flow control is only a
seldom useful feature, and primarily between systems, rather than inside them. That said,
flow control is another “consumer interest” signal like cancellation. I guess the implementers
saw that cancellation and flow control nicely unified into a “subscription”, and added both.
I still maintain that flow control is overkill with their request(n) call, but I can clearly
see the value of cancellation propagation.
We do need bi-directionality.
Composability
Given the above history and problems, I now bring my full request: Futures should be composable. CompletableFuture did a decent job of composition for downstream dependence. However, it is not enough. We need a way to formally describe the cancellation semantics of asynchronous computation. It is an error-prone pain in the ass to write this every time:
CompletableFuture<HttpRequest> requestFuture =
    CompletableFuture.completedFuture(request);

CompletableFuture<byte[]> httpResponse =
    requestFuture.thenComposeAsync(
        req -> fetchHttp(req), executor);
httpResponse.whenComplete((_, _) -> {
    if (httpResponse.isCancelled()) {
        requestFuture.cancel(true);
    }
})

CompletableFuture<MyObject> parsedResult =
        httpResponse.thenComposeAsync(
            rawJson -> validateAndConvert(rawJson), executor);
parsedResult.whenComplete((_, _) -> {
    if (parsedResult.isCancelled()) {
        httpResponse.cancel(true);
    }
});
Manually wiring cancellation is not sustainable.
Execution Context
One additional concern is how execution context is propagated along. In my case, we are using
gRPC. By default, gRPC Java propagates RPC cancellation and deadlines through a thread-local
Context object. One idea for propagating cancellation is to just wire through the cancellation
signal to the root of the dependency tree. For example, if the client RPC triggered the code
above, but then went away, maybe only the end of the dependency chain needs to be cancelled.
If the fetchHttp() call just checked the thread local gRPC context, all the chained futures
between it and the final consumer parsedResult, could be ignored. The root would transitively
cancel all the others.
The problem here is in how CF delegates work to the executor. Each dependent execution stage in CF
only triggers on completion of the source CF. This means the original calling context has been lost
by the time work is scheduled on the executor! To be specific, suppose that
CompletableFuture<HttpRequest> requestFuture was not an immediate, but instead had to be
asynchronously loaded. When it finishes and schedules the HTTP call work, it may do so on it’s
thread, or it may do so on the caller thread. We don’t know. The original gRPC context won’t
be propagated to other threads, since we don’t know how that work was scheduled. In other words,
there is no reliable way to make sure that the calling context is propagated to the async work.
This is why we need full composition with Futures. Between cancellation, deadlines, and execution context, it’s verbose and error-prone to pass these along reliably.
For those of you designing your own languages and libraries, consider these problems carefully! CompletableFuture can be used, but it can’t be re-used. When you make your implementation, make it so that the right thing is the default usually, and custom or specialized behavior doesn’t become onerous.